We can use multiple tools to monitor system statistics, but if you are looking for virtual memory, use vmstat, which support numerous options and parameters.
And you can set vmstat with screen or any other screen multiplexer for best usage.
What is vmstat?
A vmstat stands for (virtual memory statistics) is a command-line utility to get information about system process, memory, paging, interrupts, block I/O, disk and CPU activity (virtual memory statistics), and it is part of a builtin monitoring utility in Linux.
You can directly start using a vmstat to monitor, but I advised you to check the basic syntax of vmstat usage to utilize in proper terms.
Basic vmstat command syntax
The basic vmstat command does not require any options.
$ vmstat [options] [delay [count]]- [options]: you can modify the default output with several options.
- [delay [count]]: a default report or statistics consisting of the average value from the current boot. To find the latest report, provide a delay in seconds and count for the number of update cycles.
And if you try to run vmstat on your terminal screen, you will get an output that you might find overwhelming, but we are here to make it easy.
$ vmstat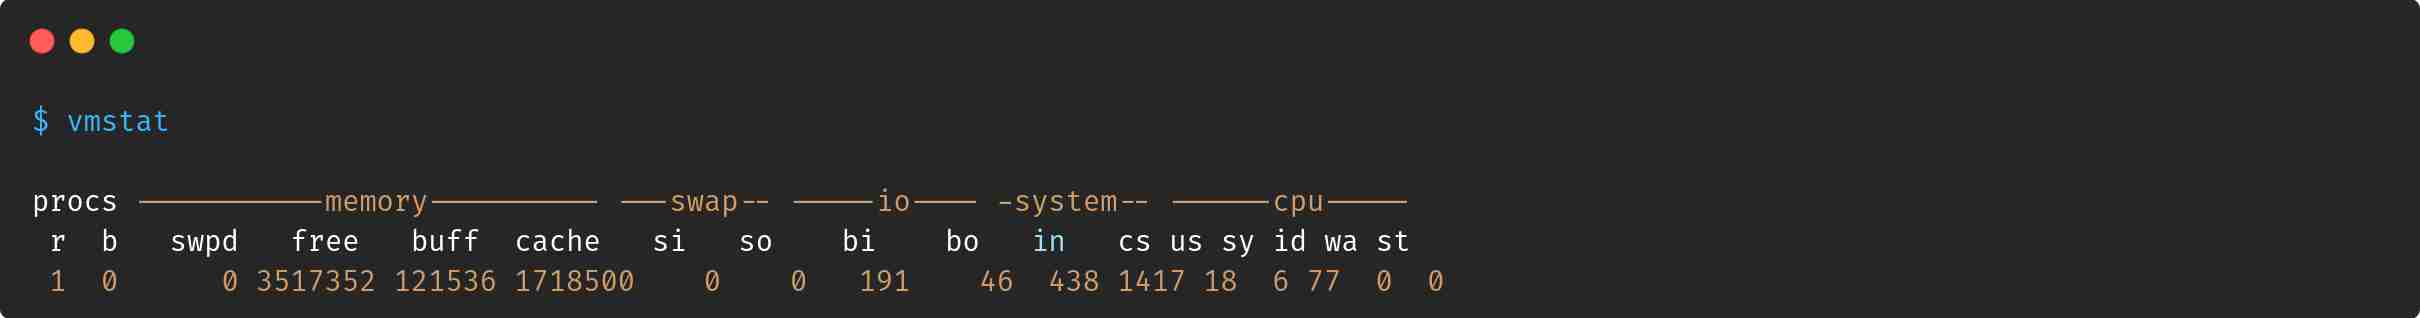
Usage of vmstat in Linux
There are several options to use with vmstat, which you will see in the next section. Before that, it’s better to know the abbreviation which is used in the above output. If you are familiar with the acronym, you can skip it.
Let’s run the vmstat command once again to examine the output.
$ vmstatA default output has six headers with the following name procs, memory, swap, io, system and CPU.
- Procs: although you know proc is known for the current process filesystem, split into two parameters, r and b
- r: stands for the runnable process. It shows the number of processes that are running or waiting for run time.
- b: number of processes is blocked.
- Memory: center of attraction is the memory it has divided into four parts.
- swpd: swap memory usage
- free: memory left to use
- buff: amount of memory used as a buffer
- cache: number of cache memory
- Swap: Swap memory usage details
- si: amount of swapped in from disk (disk to memory)
- so: amount of swapped to disk (memory to disk)
- System: Details about system interruptions and context switches
- in: number of interrupts in seconds
- cs: number of context switches per second (context switch is known handling process state)
- IO: Information about blocks(storage) devices or file
- bi: number of blocks received from a block devices
- bo: number of blocks send to block devices
- CPU: All the major information about CPU stress and data is shown in percentage
- us: user time to spend which run in kernel userspace.
- sy: system time to spend run in kernel space
- id: idle time
- wa: time wait for IO
- st: steal time help you to know the average wait time for virtual machine process to complete.
Find inactive and active memory using vmstat
Inactive and active memory is not a part of the default header. You can easily find inactive and active memory usage with -a parameter.
$ vmstat -a 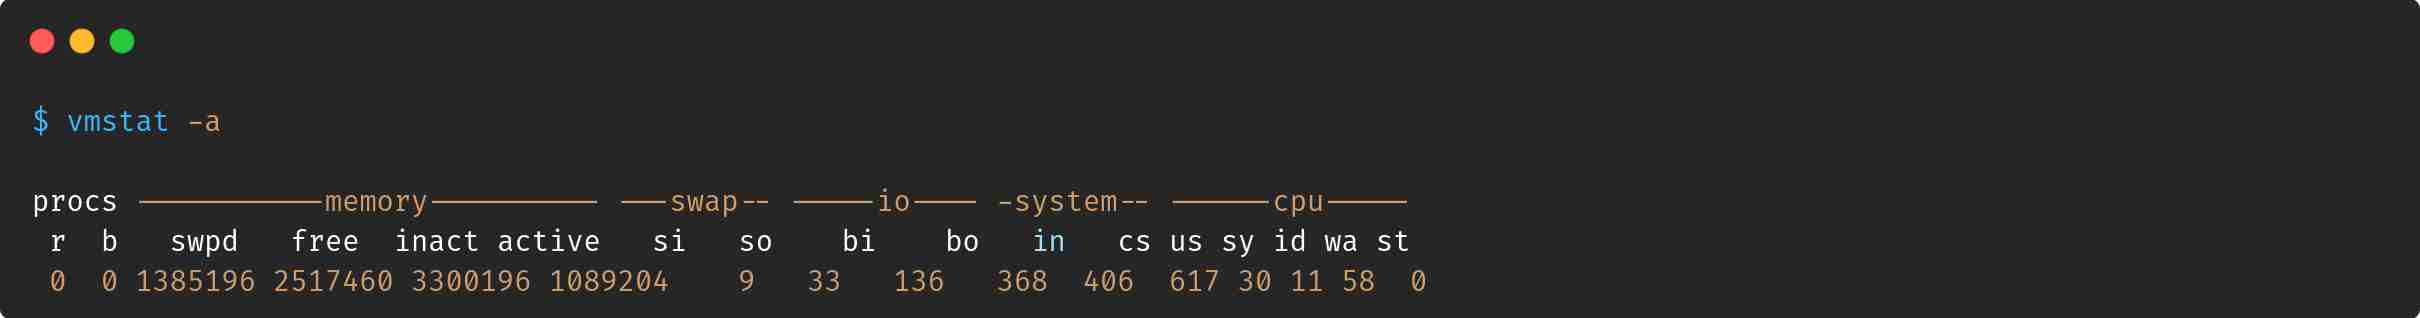
If you are unsure about inactive or active memory, I’ll make it clear for you. Inactive memory is space that is used recently, and active memory is used by currently running programs.
Change unit size in vmstat
The default output shows the data unit in Kilobyte, which looks odd. You can change units in various sizes like k, K, m or, M with the help of -S or –unit parameters.
To print data in Megabyte, you can type the below command.
$ vmstat -a -S M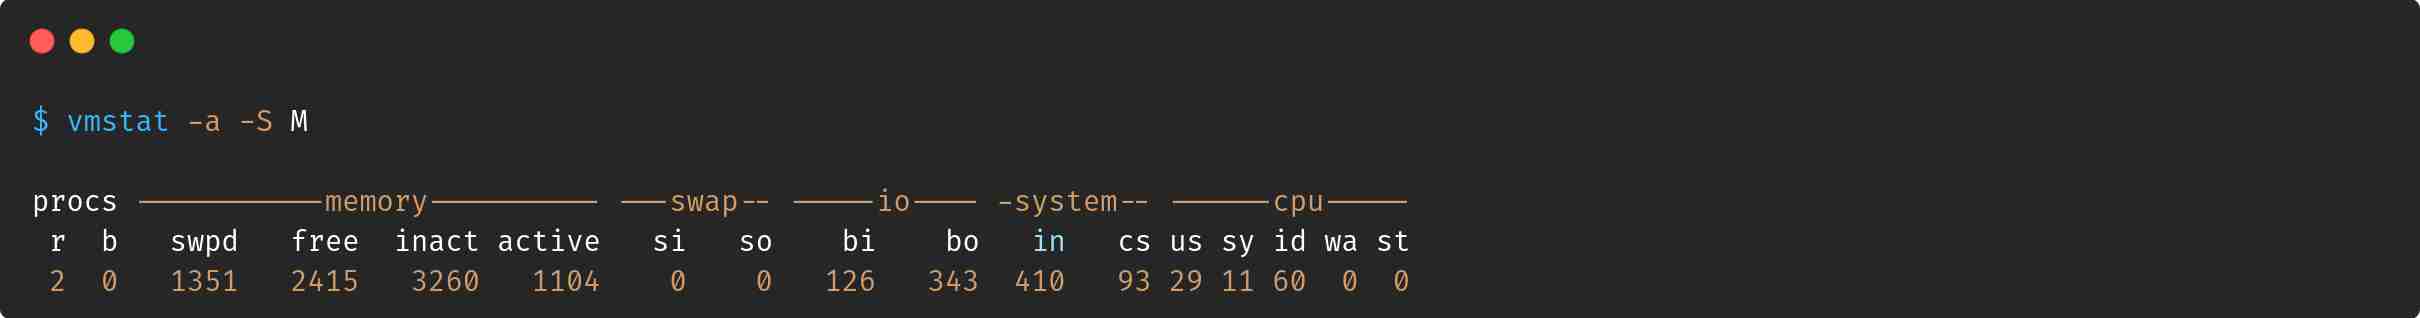
What do you say Gigabyte options should be included, right?
Find number of forks since boot
Not sure what is forks? Forks show the number of processes that have been created from the parent process, and the forks process is called a child of the parent process.
We can find the number of forks with the help of -f or –forks.
$ vmstat -f
The above output shows the number of forks created since system boot.
Check Disk status using vmstat
You can use vmstat to find disk performance along with mem information, vmstat will list the number of storage peripherals, read, writes along with IO.
You can use -d or –disk parameters to check that.
$ vmstat -d 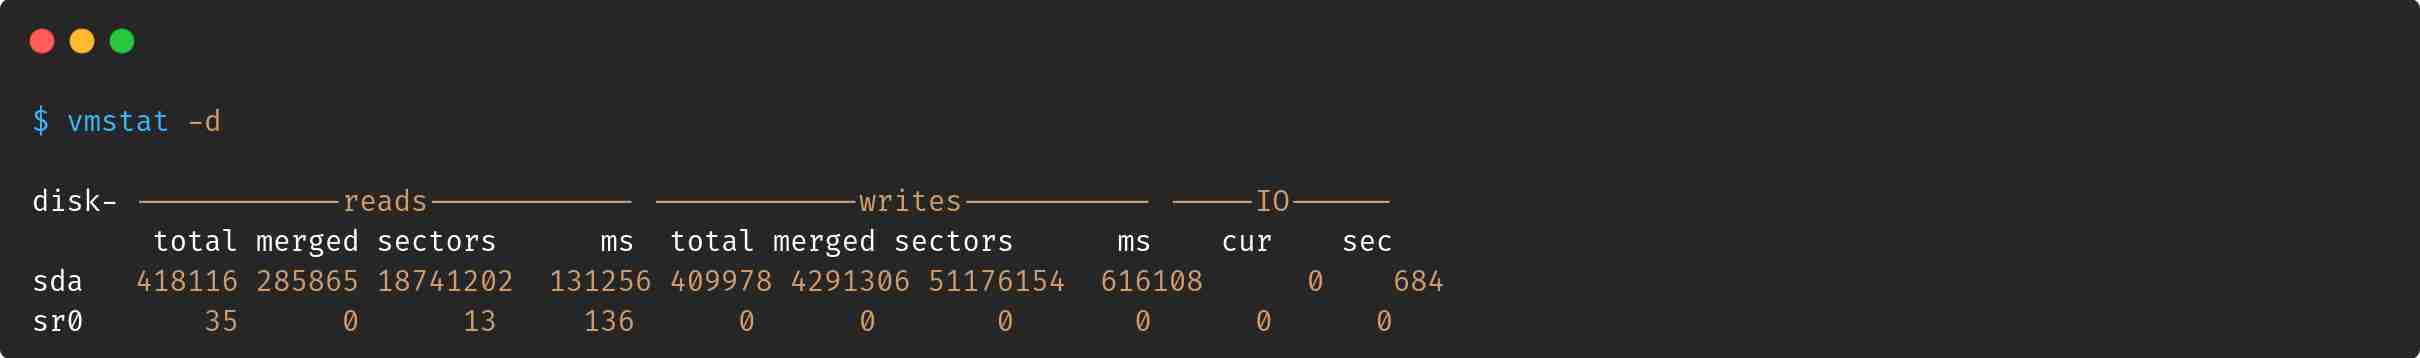
It shows two block devices, sda for SSD and sr0 as CD-ROM, and the rest is a performance of individual blocks.
If you are interested to know the overall disk statistic, type the below command.
$ vmstat -D 
Get all memory info similar to /proc/meminfo
To get all sorts of information such as memory, CPU, boot time, forks, events and ., etc., with the help of -s parameter.
We have added a few extra parameters to print data in Megabyte over Kilobyte.
$ vmstat -s -S M
Although you find all this information from /proc/meminfo, but you cannot control the size of respective columns.
Use timestamp
You can modify the default vmstat header with a timestamp header which can be helpful in delay options. To print timestamp, use -t or –timestamp.
$ vmstat --timestamp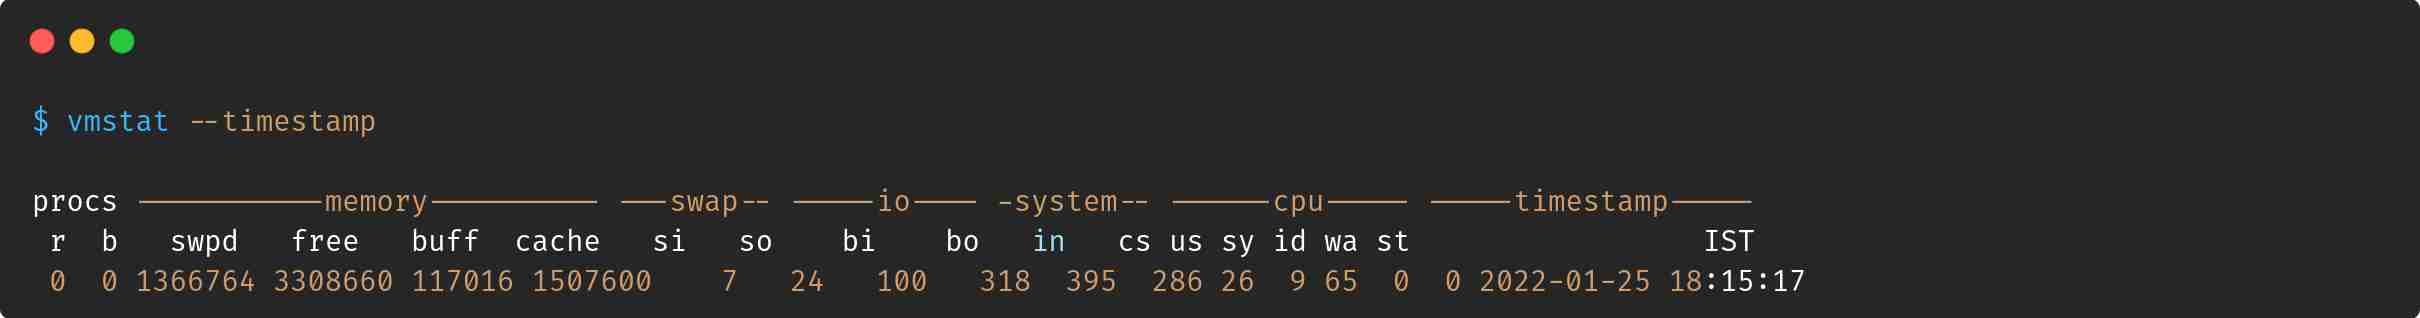
Use a delay to find latest memory info
A fun part begins here. You can use delay options to monitor system performance with a specific interval of time. In other words, you can say vmstat command will auto-execute after a certain period.
If your requirement is to print system information every 2 seconds, type the below command for the interruption. You can press Ctrl-C.
$ vmstat 2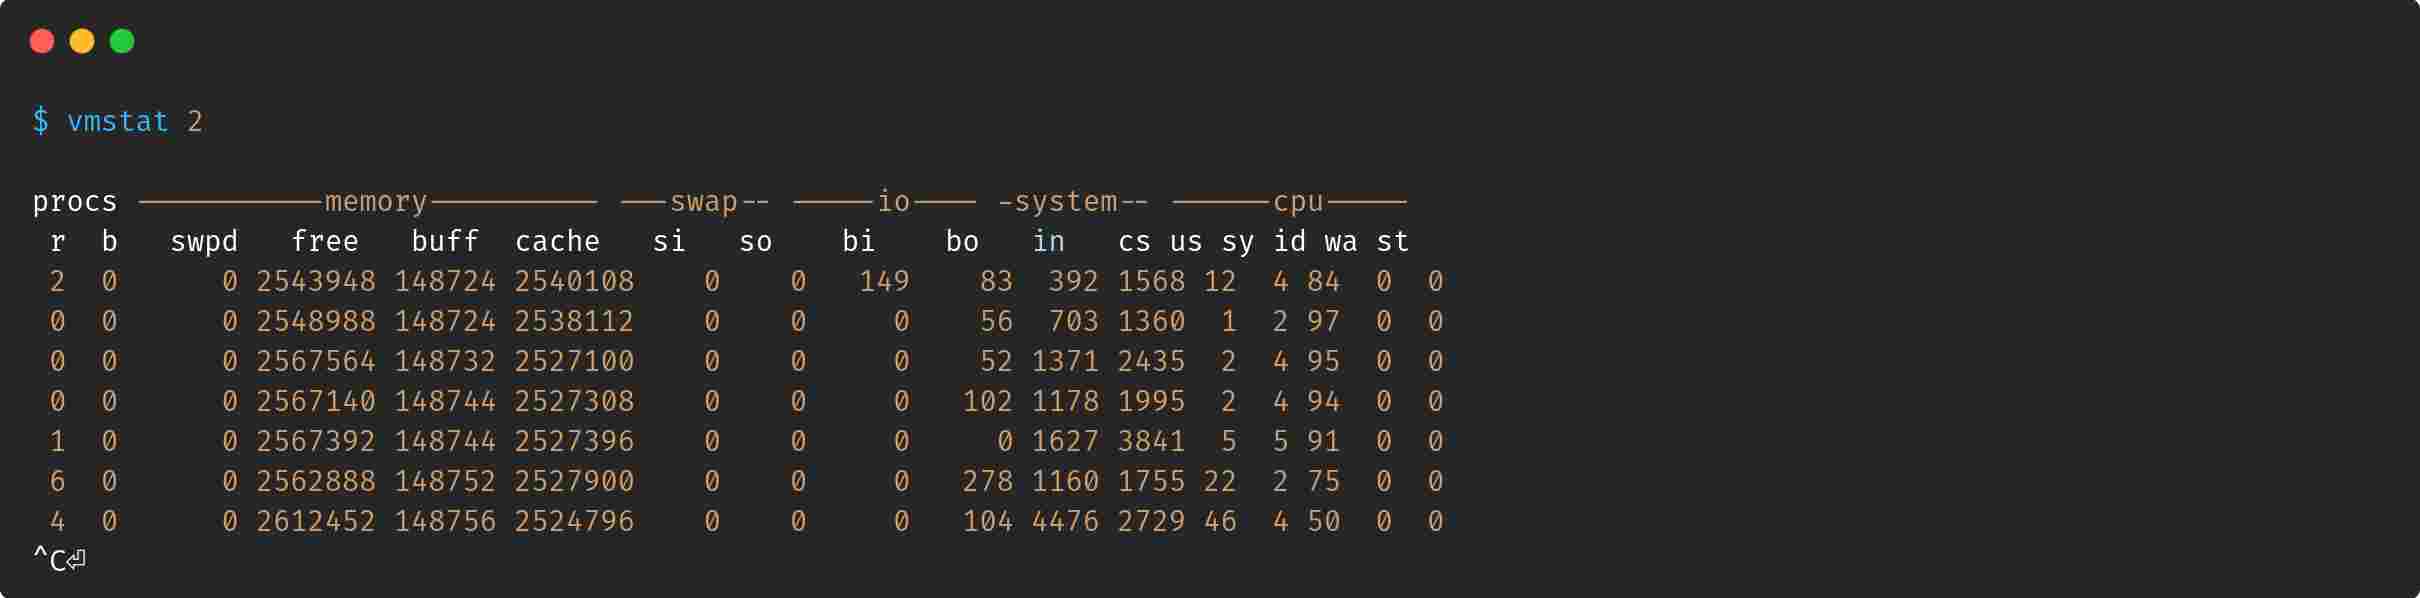
Check this Interrupt or Suspend a Command Execution in Linux
You can also auto-stop vmstat output after a certain number of counts or updates. For example, if you want to print system information every 2 seconds, and the command should interrupt after five cycles.
$ vmstat 2 5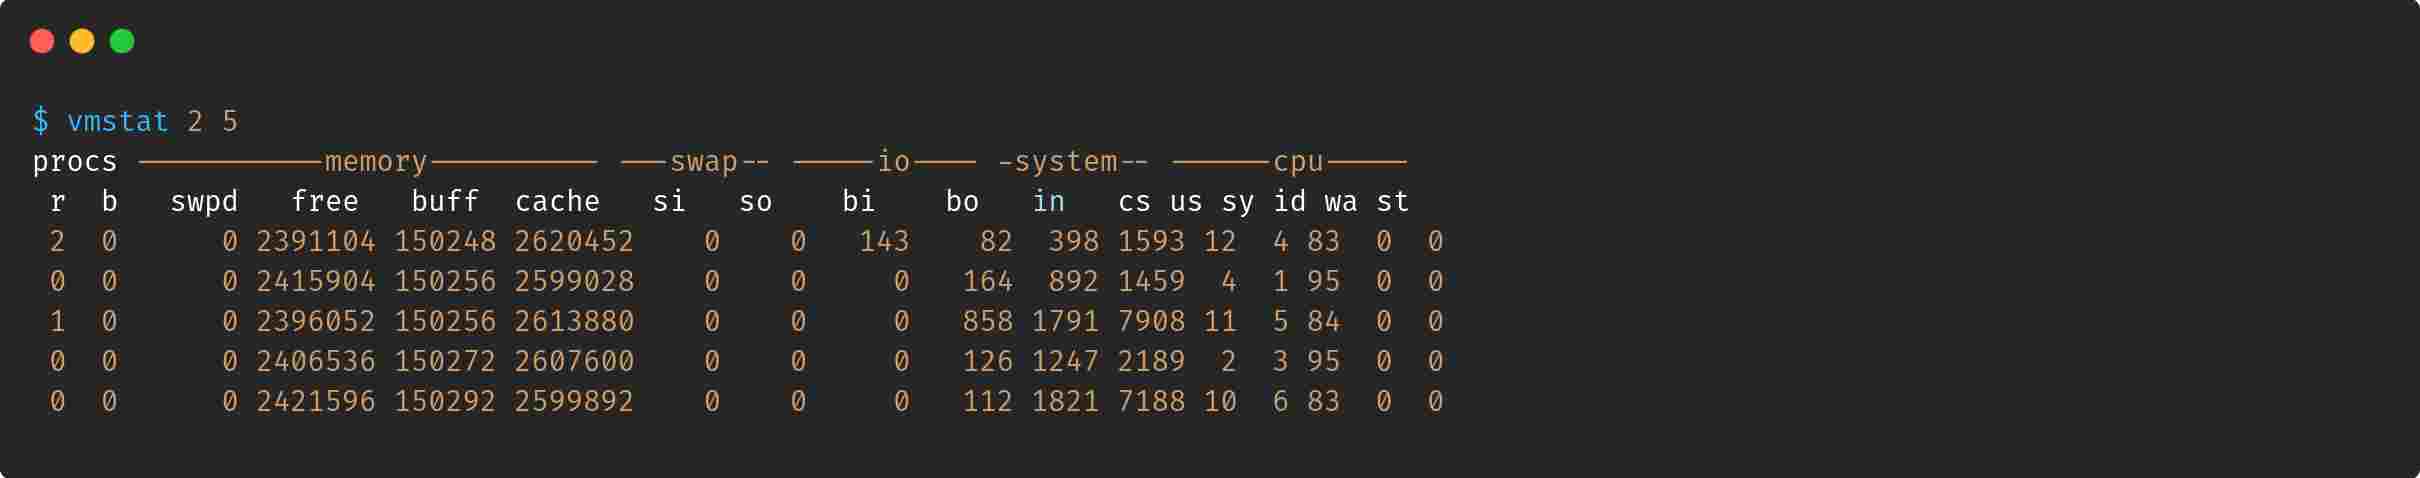
Sometimes output may get complex when you run the above command for a longer period, and it’s impossible to know the exact time of output.
To resolve this, you can use -t or –timestamps along with delay and count.
$ vmstat -t 2 5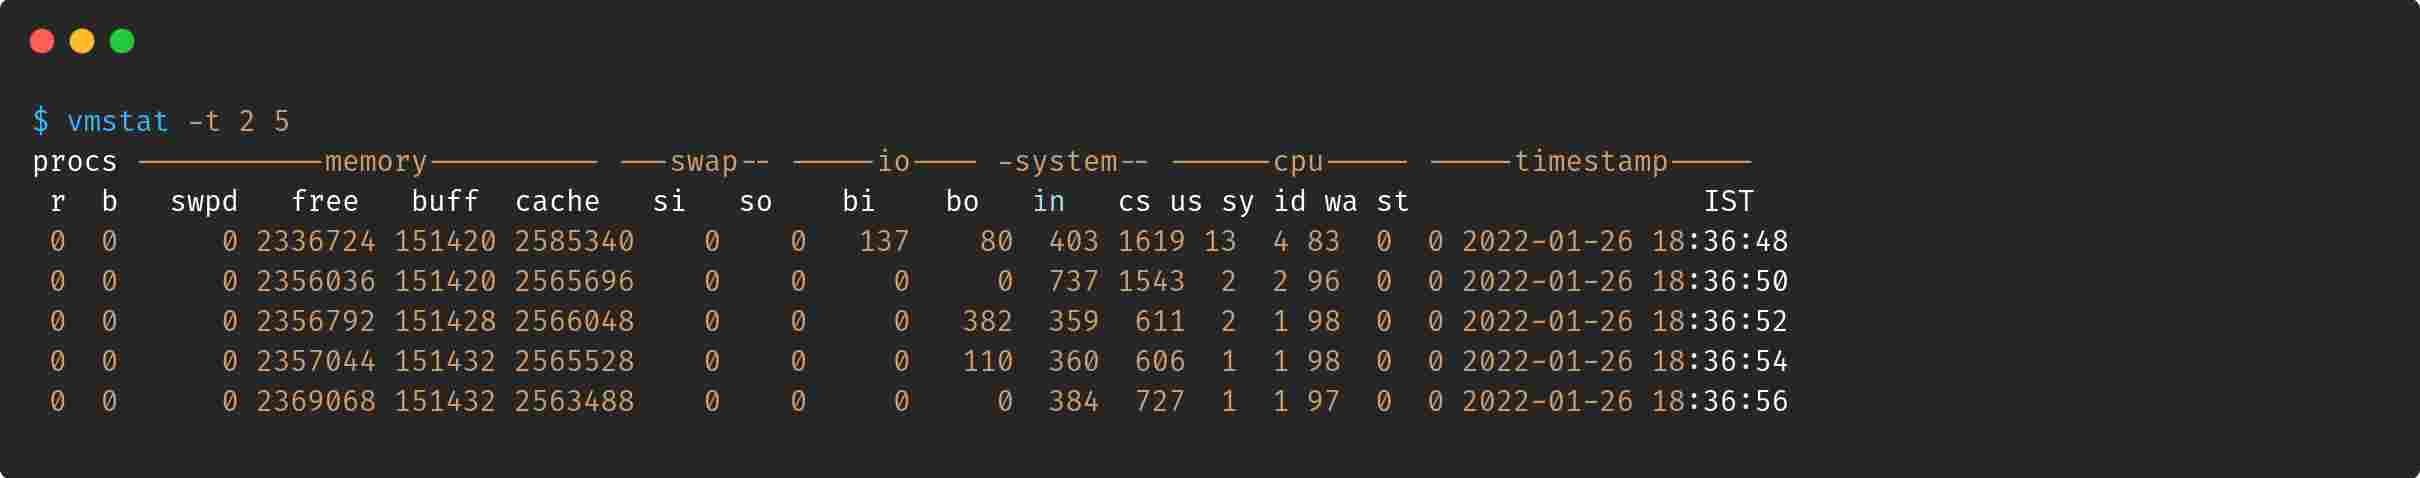
Wrap up
That’s all from my end. If you want to learn more about vmstat, use man vmstat command. Although you know all the data get extracted from /proc/meminfo,/proc/stat, and /proc/*/stat.
We will post articles on top command to monitor your system in the upcoming days. So, make sure to subscribe to our newsletter.